Kibot Chart
After Event Chart Explanation
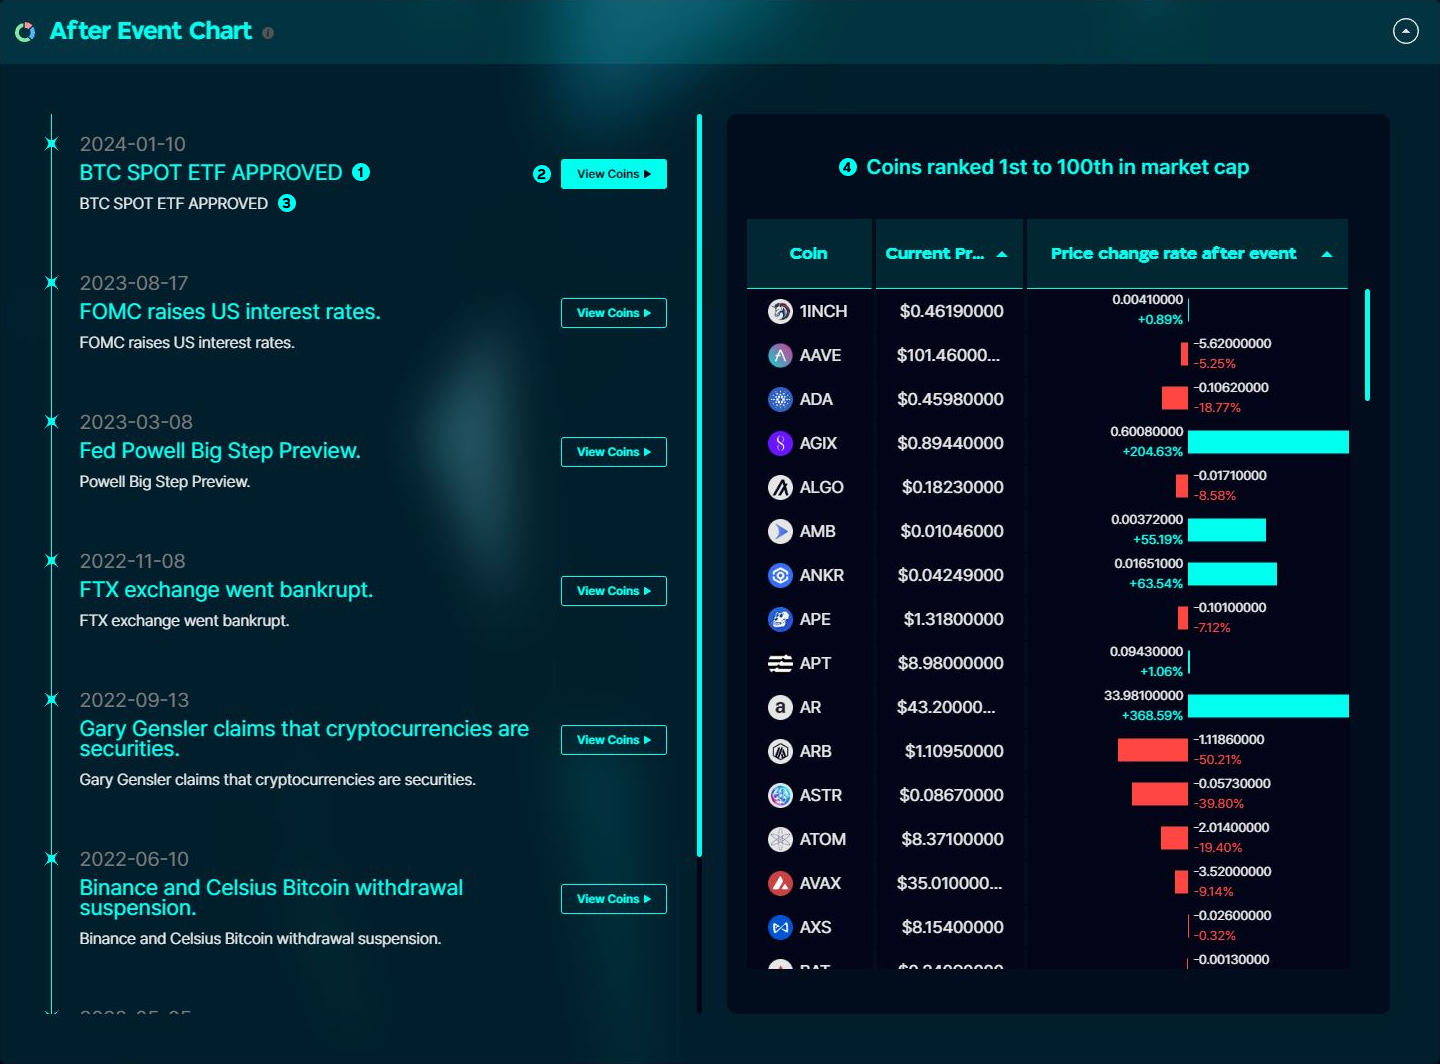
This is a tool to analyze market reactions after important events occur in the cryptocurrency market such as FTX and LUNA.
It has the ability to analyze market trends after an important event occurs and predict which stocks are likely to rise or fall when similar events occur.

The event occurrence date and event title are displayed.
Click the button to check the coin price on the eventdate.
An additional explanation of the event is displayed.
Compares the coin price at the time from 1st to 100th in market capitalization with the current price, and calculates and displays the percentage change in price by how much the price has risen of fallen.