'/%3e%3cdefs%3e%3clinearGradient%20id='paint0_linear_853_12573'%20x1='205'%20y1='32'%20x2='1.04269e-06'%20y2='32'%20gradientUnits='userSpaceOnUse'%3e%3cstop%20stop-color='%2300FFEF'/%3e%3cstop%20offset='1'%20stop-color='%23007FFF'/%3e%3c/linearGradient%3e%3c/defs%3e%3c/svg%3e)
 Kibot Chart
- Kibot Auto
- Profit Status
- Price
- Class
- Daily Info


'%3e%3cpath%20d='M11.5152%208.18181C11.5152%207.84847%2011.2424%207.57574%2010.9091%207.57574H8.48485C8.15152%207.57574%207.87879%207.84847%207.87879%208.18181V16.6667H11.5152V8.18181ZM16.6667%209.39393C16.6667%209.06059%2016.3939%208.78787%2016.0606%208.78787H13.6364C13.303%208.78787%2013.0303%209.06059%2013.0303%209.39393V16.6667H16.6667V9.39393ZM19.0909%2018.1818H0.909091C0.406061%2018.1818%200%2018.5879%200%2019.0909C0%2019.5939%200.406061%2020%200.909091%2020H19.0909C19.5939%2020%2020%2019.5939%2020%2019.0909C20%2018.5879%2019.5939%2018.1818%2019.0909%2018.1818ZM6.36364%2011.2121C6.36364%2010.8788%206.09091%2010.606%205.75758%2010.606H3.33333C3%2010.606%202.72727%2010.8788%202.72727%2011.2121V16.6667H6.36364V11.2121Z'%20fill='%237A7A7A'/%3e%3cpath%20d='M17.5458%20-1.45033e-05L14.8186%200.387864C14.3822%200.44847%2014.2004%200.987864%2014.5155%201.30302L15.1458%201.93332L12.9458%204.13332L9.33371%201.39392C9.00037%201.13938%208.53371%201.1515%208.20643%201.41817L2.44886%206.1515C2.06098%206.47271%202.00643%207.04241%202.32159%207.43029C2.5034%207.64847%202.76401%207.76362%203.02462%207.76362C3.22462%207.76362%203.43068%207.69696%203.60037%207.55756L8.80037%203.27877L12.4731%206.06059C12.8367%206.33332%2013.3458%206.30302%2013.667%205.9818L16.4246%203.22423L16.8428%203.64241C17.1579%203.95756%2017.6913%203.77574%2017.7579%203.33938L18.1458%200.612107C18.1943%200.254531%2017.8913%20-0.0484994%2017.5398%200.0060461L17.5458%20-1.45033e-05Z'%20fill='%237A7A7A'/%3e%3c/g%3e%3cdefs%3e%3cclipPath%20id='clip0_1666_2971'%3e%3crect%20width='20'%20height='20'%20fill='white'/%3e%3c/clipPath%3e%3c/defs%3e%3c/svg%3e) Kibot Chart
Kibot Chart 
 Kibot Auto
  Profit Status
 '%3e%3cpath%20d='M7.86145%2017.7116C6.95239%2017.7116%206.21484%2018.4493%206.21484%2019.3529C6.21484%2020.2565%206.95239%2020.9943%207.86145%2020.9943C8.77052%2020.9943%209.50806%2020.2565%209.50806%2019.3529C9.50806%2018.4493%208.77052%2017.7116%207.86145%2017.7116ZM16.1517%2017.7116C15.2426%2017.7116%2014.5051%2018.4493%2014.5051%2019.3529C14.5051%2020.2565%2015.2426%2020.9943%2016.1517%2020.9943C17.0607%2020.9943%2017.7983%2020.2565%2017.7983%2019.3529C17.7983%2018.4493%2017.0607%2017.7116%2016.1517%2017.7116Z'%20fill='%237A7A7A'/%3e%3cpath%20d='M19.8508%203.12827H5.38579L4.90553%201.28105C4.76831%200.543301%204.11653%200%203.36183%200H1.00054C0.445957%200%200%200.446078%200%201.00082C0%201.55556%200.445957%202.00163%201.00054%202.00163H3.03022L5.73455%2012.4216L4.65968%2014.8979C4.52818%2015.2067%204.55677%2015.5613%204.73972%2015.8472C4.92268%2016.1275%205.23714%2016.299%205.57446%2016.299H18.1527C18.7073%2016.299%2019.1533%2015.8529%2019.1533%2015.2982C19.1533%2014.7435%2018.7073%2014.2974%2018.1527%2014.2974H7.10101L7.70705%2012.902C7.70705%2012.902%207.71277%2012.8676%207.71849%2012.8505H18.1013C18.633%2012.8505%2019.0904%2012.4845%2019.2162%2011.9698L20.9657%204.53513C21.1372%203.81454%2020.5883%203.12827%2019.8508%203.12827ZM10.1369%209.45915C10.1369%209.85376%209.81677%2010.174%209.42227%2010.174C9.02777%2010.174%208.7076%209.85376%208.7076%209.45915V6.51961C8.7076%206.125%209.02777%205.80474%209.42227%205.80474C9.81677%205.80474%2010.1369%206.125%2010.1369%206.51961V9.45915ZM13.5674%209.45915C13.5674%209.85376%2013.2472%2010.174%2012.8527%2010.174C12.4582%2010.174%2012.138%209.85376%2012.138%209.45915V6.51961C12.138%206.125%2012.4582%205.80474%2012.8527%205.80474C13.2472%205.80474%2013.5674%206.125%2013.5674%206.51961V9.45915ZM16.9978%209.45915C16.9978%209.85376%2016.6776%2010.174%2016.2831%2010.174C15.8886%2010.174%2015.5685%209.85376%2015.5685%209.45915V6.51961C15.5685%206.125%2015.8886%205.80474%2016.2831%205.80474C16.6776%205.80474%2016.9978%206.125%2016.9978%206.51961V9.45915Z'%20fill='%237A7A7A'/%3e%3c/g%3e%3cdefs%3e%3cclipPath%20id='clip0_1666_3162'%3e%3crect%20width='21'%20height='21'%20fill='white'/%3e%3c/clipPath%3e%3c/defs%3e%3c/svg%3e) Price
Price '%3e%3cpath%20d='M3.01622%2016.5571H1.08108C0.632432%2016.5571%200.27027%2016.9209%200.27027%2017.3714C0.27027%2017.822%200.632432%2018.1857%201.08108%2018.1857H3.01622C3.45405%2018.1857%203.78378%2017.822%203.78378%2017.3823V17.366C3.78378%2016.9263%203.45405%2016.5626%203.01622%2016.5626V16.5571ZM18.3784%200H1.62162C0.724324%200%200%200.727429%200%201.62857V12.4857C0%2013.3869%200.724324%2014.1143%201.62162%2014.1143H18.3784C19.2757%2014.1143%2020%2013.3869%2020%2012.4857V1.62857C20%200.727429%2019.2757%200%2018.3784%200ZM10%203.25714C11.0811%203.25714%2011.9568%204.13657%2011.9568%205.22229C11.9568%206.308%2011.0811%207.18743%2010%207.18743C8.91892%207.18743%208.04324%206.308%208.04324%205.22229C8.04324%204.13657%208.91892%203.25714%2010%203.25714ZM13.2865%2010.9114C13.2865%2011.1774%2013.0865%2011.4%2012.8378%2011.4H7.16757C6.91892%2011.4%206.71892%2011.1829%206.71892%2010.9114V10.45C6.71892%209.56514%207.37838%208.84857%208.2%208.84857H11.8108C12.627%208.84857%2013.2919%209.56514%2013.2919%2010.45V10.9114H13.2865ZM18.9189%2016.5571H11.0378C10.6%2016.5571%2010.2703%2016.9209%2010.2703%2017.3606V17.3769C10.2703%2017.8166%2010.6%2018.1803%2011.0378%2018.1803H18.9189C19.3676%2018.1803%2019.7297%2017.8166%2019.7297%2017.366C19.7297%2016.9154%2019.3676%2016.5517%2018.9189%2016.5517V16.5571Z'%20fill='%237A7A7A'/%3e%3cpath%20d='M7.0269%2019C7.92249%2019%208.64852%2018.2709%208.64852%2017.3714C8.64852%2016.472%207.92249%2015.7429%207.0269%2015.7429C6.1313%2015.7429%205.40527%2016.472%205.40527%2017.3714C5.40527%2018.2709%206.1313%2019%207.0269%2019Z'%20fill='%237A7A7A'/%3e%3c/g%3e%3cdefs%3e%3cclipPath%20id='clip0_1666_2977'%3e%3crect%20width='20'%20height='19'%20fill='white'/%3e%3c/clipPath%3e%3c/defs%3e%3c/svg%3e) Kibot Class
Kibot Class  Daily Info
  [email protected]
'%3e%3cpath%20d='M15.6504%205.57384C15.5748%205.57384%2015.5046%205.58472%2015.429%205.59559C14.6678%202.38724%2011.8498%200%208.4919%200C5.13401%200%202.31597%202.38724%201.54938%205.59559C1.4846%205.58472%201.41442%205.57384%201.34963%205.57384C0.604636%205.57384%200%206.18289%200%206.93331V8.56468C0%209.31511%200.604636%209.92416%201.34963%209.92416C1.51159%209.92416%201.66815%209.89153%201.81391%209.83715C2.2134%2010.8432%203.17974%2011.5555%204.31883%2011.5555C4.61575%2011.5555%204.85869%2011.3108%204.85869%2011.0117C4.85869%2010.7127%204.61575%2010.4679%204.31883%2010.4679C3.42807%2010.4679%202.69927%209.73383%202.69927%208.83658V7.11277C2.81804%203.92072%205.36615%201.35947%208.4919%201.35947C11.6177%201.35947%2014.2953%204.04036%2014.2953%207.33572C14.2953%207.34659%2014.3007%207.36291%2014.3007%207.37378V8.56468C14.3007%209.31511%2014.9054%209.92416%2015.6504%209.92416C16.3954%209.92416%2017%209.31511%2017%208.56468V6.93331C17%206.18289%2016.3954%205.57384%2015.6504%205.57384Z'%20fill='%2300FFEF'/%3e%3cpath%20d='M12.9238%2013.1814H11.342C10.9911%2013.1814%2010.6564%2013.3555%2010.4567%2013.6437L9.34997%2015.2424C8.91809%2015.8678%207.99494%2015.8623%207.57385%2015.2315L6.51574%2013.66C6.31599%2013.3609%205.98128%2013.1814%205.62498%2013.1814H4.0702C2.06734%2013.1814%200.442383%2014.8182%200.442383%2016.8357V18.4562C0.442383%2018.7553%200.685317%2019%200.982237%2019H16.0226C16.3195%2019%2016.5624%2018.7553%2016.5624%2018.4562V16.8357C16.5624%2014.8182%2014.9375%2013.1814%2012.9346%2013.1814H12.9238ZM8.4916%2011.822C10.9479%2011.822%2012.94%209.81539%2012.94%207.34115C12.94%204.8669%2010.9479%202.86032%208.4916%202.86032C6.03527%202.86032%204.04321%204.8669%204.04321%207.34115C4.04321%209.81539%206.03527%2011.822%208.4916%2011.822Z'%20fill='%2300FFEF'/%3e%3c/g%3e%3cdefs%3e%3cclipPath%20id='clip0_1666_3068'%3e%3crect%20width='17'%20height='19'%20fill='white'/%3e%3c/clipPath%3e%3c/defs%3e%3c/svg%3e) 1:1 Inquiry
1:1 Inquiry
'%3e%3cpath%20d='M22.2288%2017.6132L21.3269%2016.3396L15.4217%208H9L17.7344%2020.4479L18.6348%2021.7311L24.4368%2030H31L22.2288%2017.6132ZM19.595%2020.6309L18.6954%2019.3487L11.7099%209.39322H14.6709L20.3671%2017.4373L21.2697%2018.7122L28.2762%2028.6068H25.1917L19.5951%2020.6308L19.595%2020.6309Z'%20fill='%23010416'/%3e%3cpath%20d='M18.6955%2019.3486L19.595%2020.6309L18.6348%2021.731L11.4177%2029.9999H9.38086L17.7344%2020.4478L18.6955%2019.3486Z'%20fill='%23010416'/%3e%3cpath%20d='M30.6192%208L22.2288%2017.6132L21.2695%2018.7122L20.3671%2017.4373L21.3269%2016.3396L28.62%208H30.6192Z'%20fill='%23010416'/%3e%3c/g%3e%3cdefs%3e%3cclipPath%20id='clip0_574_9336'%3e%3crect%20width='22'%20height='22'%20fill='white'%20transform='translate(9%208)'/%3e%3c/clipPath%3e%3c/defs%3e%3c/svg%3e)


Terms and Privacy Policy
(c)2023-2024Kibot Chart
Dominance Explanation
Pie Chart
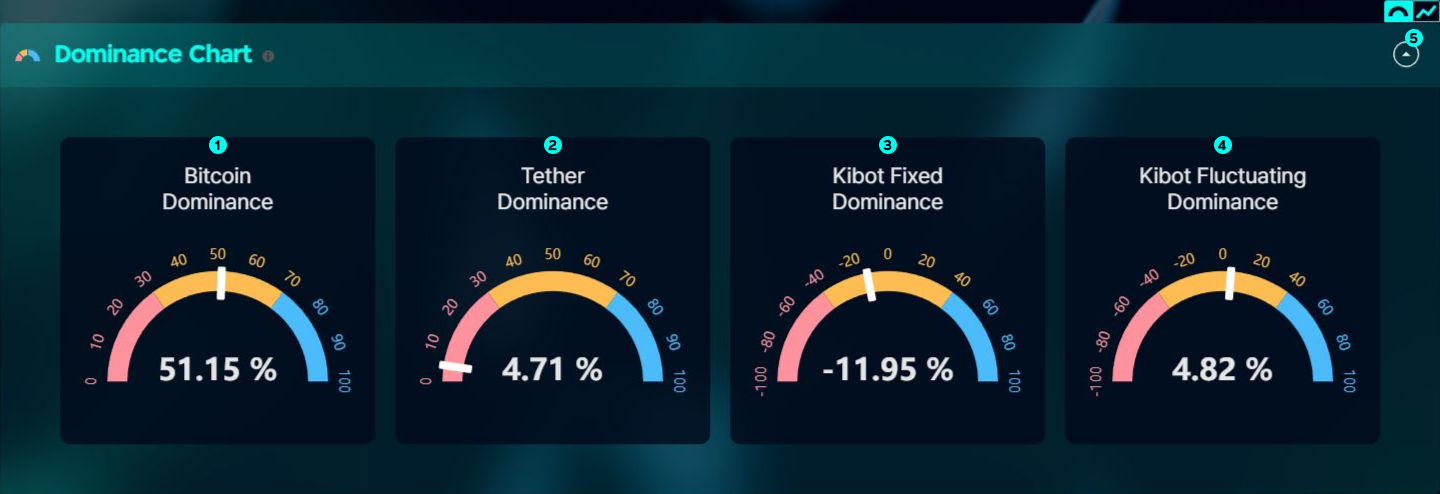
It is a percentage of Bitcoin’s market capitalization.
When the market atmosphere is bad, the decline of altcoins is steeper than that of Bitcoin, so Bitcoin dominance may increase.
This indicates how much USDT worth $1 has.
Shows the current price of the Kibot Fixed Index.
It refers of the average score obtained by adding up the coin scores given every hour for all coins and dividing them by the total number of coins.
By looking at this score, you can determine whether the current coin market is in a bull market or bear market.
If the dominance chart average value and arrow move to the plus side, an uptrend graph appears, and if they move to the minus side, a downtrend graph appears.
Shows the current price of the Kibot Fluctuating Index.
It means the average value of adding up the Kibot score for each coin in the previous time period and the changed score for each coin at the current time and dividing it by the number of coins.
By looking at this score, you can judge from a short-term perspective whether the number of coins is rising or falling every hour
If the score is +, it is advantageous to select the L signal coin for short-term trading, and if the score is -, it is advantageous to select the S signal coin for short-term trading.
Switch Pie Chart / Line Chart
Line Chart

It is a percentage of Bitcoin’s market capitalization.
When the market atmosphere is bad, the decline of altcoins is steeper than that of Bitcoin, so Bitcoin dominance may increase.
This indicates how much USDT worth $1 has.
Shows the current price of the Kibot Fixed Index.
It refers of the average score obtained by adding up the coin scores given every hour for all coins and dividing them by the total number of coins.
By looking at this score, you can determine whether the current coin market is in a bull market or bear market.
If the dominance chart average value and arrow move to the plus side, an uptrend graph appears, and if they move to the minus side, a downtrend graph appears.
Shows the current price of the Kibot Fluctuating Index.
It means the average value of adding up the Kibot score for each coin in the previous time period and the changed score for each coin at the current time and dividing it by the number of coins.
By looking at this score, you can judge from a short-term perspective whether the number of coins is rising or falling every hour
If the score is +, it is advantageous to select the L signal coin for short-term trading, and if the score is -, it is advantageous to select the S signal coin for short-term trading.
Switch Pie Chart / Line Chart
Dominance line chart is a chart that shows all the past data of the dominance chart,
and you can check the chart trend for 2 days, 1 week, 2 weeks, and 1 month through the ‘Period’ option.