'/%3e%3cdefs%3e%3clinearGradient%20id='paint0_linear_853_12573'%20x1='205'%20y1='32'%20x2='1.04269e-06'%20y2='32'%20gradientUnits='userSpaceOnUse'%3e%3cstop%20stop-color='%2300FFEF'/%3e%3cstop%20offset='1'%20stop-color='%23007FFF'/%3e%3c/linearGradient%3e%3c/defs%3e%3c/svg%3e)
 Kibot Chart
- Kibot Auto
- Profit Status
- Price
- Class
- Daily Info


'%3e%3cpath%20d='M11.5152%208.18181C11.5152%207.84847%2011.2424%207.57574%2010.9091%207.57574H8.48485C8.15152%207.57574%207.87879%207.84847%207.87879%208.18181V16.6667H11.5152V8.18181ZM16.6667%209.39393C16.6667%209.06059%2016.3939%208.78787%2016.0606%208.78787H13.6364C13.303%208.78787%2013.0303%209.06059%2013.0303%209.39393V16.6667H16.6667V9.39393ZM19.0909%2018.1818H0.909091C0.406061%2018.1818%200%2018.5879%200%2019.0909C0%2019.5939%200.406061%2020%200.909091%2020H19.0909C19.5939%2020%2020%2019.5939%2020%2019.0909C20%2018.5879%2019.5939%2018.1818%2019.0909%2018.1818ZM6.36364%2011.2121C6.36364%2010.8788%206.09091%2010.606%205.75758%2010.606H3.33333C3%2010.606%202.72727%2010.8788%202.72727%2011.2121V16.6667H6.36364V11.2121Z'%20fill='%237A7A7A'/%3e%3cpath%20d='M17.5458%20-1.45033e-05L14.8186%200.387864C14.3822%200.44847%2014.2004%200.987864%2014.5155%201.30302L15.1458%201.93332L12.9458%204.13332L9.33371%201.39392C9.00037%201.13938%208.53371%201.1515%208.20643%201.41817L2.44886%206.1515C2.06098%206.47271%202.00643%207.04241%202.32159%207.43029C2.5034%207.64847%202.76401%207.76362%203.02462%207.76362C3.22462%207.76362%203.43068%207.69696%203.60037%207.55756L8.80037%203.27877L12.4731%206.06059C12.8367%206.33332%2013.3458%206.30302%2013.667%205.9818L16.4246%203.22423L16.8428%203.64241C17.1579%203.95756%2017.6913%203.77574%2017.7579%203.33938L18.1458%200.612107C18.1943%200.254531%2017.8913%20-0.0484994%2017.5398%200.0060461L17.5458%20-1.45033e-05Z'%20fill='%237A7A7A'/%3e%3c/g%3e%3cdefs%3e%3cclipPath%20id='clip0_1666_2971'%3e%3crect%20width='20'%20height='20'%20fill='white'/%3e%3c/clipPath%3e%3c/defs%3e%3c/svg%3e) Kibot Chart
Kibot Chart 
 Kibot Auto
  Profit Status
 '%3e%3cpath%20d='M7.86145%2017.7116C6.95239%2017.7116%206.21484%2018.4493%206.21484%2019.3529C6.21484%2020.2565%206.95239%2020.9943%207.86145%2020.9943C8.77052%2020.9943%209.50806%2020.2565%209.50806%2019.3529C9.50806%2018.4493%208.77052%2017.7116%207.86145%2017.7116ZM16.1517%2017.7116C15.2426%2017.7116%2014.5051%2018.4493%2014.5051%2019.3529C14.5051%2020.2565%2015.2426%2020.9943%2016.1517%2020.9943C17.0607%2020.9943%2017.7983%2020.2565%2017.7983%2019.3529C17.7983%2018.4493%2017.0607%2017.7116%2016.1517%2017.7116Z'%20fill='%237A7A7A'/%3e%3cpath%20d='M19.8508%203.12827H5.38579L4.90553%201.28105C4.76831%200.543301%204.11653%200%203.36183%200H1.00054C0.445957%200%200%200.446078%200%201.00082C0%201.55556%200.445957%202.00163%201.00054%202.00163H3.03022L5.73455%2012.4216L4.65968%2014.8979C4.52818%2015.2067%204.55677%2015.5613%204.73972%2015.8472C4.92268%2016.1275%205.23714%2016.299%205.57446%2016.299H18.1527C18.7073%2016.299%2019.1533%2015.8529%2019.1533%2015.2982C19.1533%2014.7435%2018.7073%2014.2974%2018.1527%2014.2974H7.10101L7.70705%2012.902C7.70705%2012.902%207.71277%2012.8676%207.71849%2012.8505H18.1013C18.633%2012.8505%2019.0904%2012.4845%2019.2162%2011.9698L20.9657%204.53513C21.1372%203.81454%2020.5883%203.12827%2019.8508%203.12827ZM10.1369%209.45915C10.1369%209.85376%209.81677%2010.174%209.42227%2010.174C9.02777%2010.174%208.7076%209.85376%208.7076%209.45915V6.51961C8.7076%206.125%209.02777%205.80474%209.42227%205.80474C9.81677%205.80474%2010.1369%206.125%2010.1369%206.51961V9.45915ZM13.5674%209.45915C13.5674%209.85376%2013.2472%2010.174%2012.8527%2010.174C12.4582%2010.174%2012.138%209.85376%2012.138%209.45915V6.51961C12.138%206.125%2012.4582%205.80474%2012.8527%205.80474C13.2472%205.80474%2013.5674%206.125%2013.5674%206.51961V9.45915ZM16.9978%209.45915C16.9978%209.85376%2016.6776%2010.174%2016.2831%2010.174C15.8886%2010.174%2015.5685%209.85376%2015.5685%209.45915V6.51961C15.5685%206.125%2015.8886%205.80474%2016.2831%205.80474C16.6776%205.80474%2016.9978%206.125%2016.9978%206.51961V9.45915Z'%20fill='%237A7A7A'/%3e%3c/g%3e%3cdefs%3e%3cclipPath%20id='clip0_1666_3162'%3e%3crect%20width='21'%20height='21'%20fill='white'/%3e%3c/clipPath%3e%3c/defs%3e%3c/svg%3e) Price
Price '%3e%3cpath%20d='M3.01622%2016.5571H1.08108C0.632432%2016.5571%200.27027%2016.9209%200.27027%2017.3714C0.27027%2017.822%200.632432%2018.1857%201.08108%2018.1857H3.01622C3.45405%2018.1857%203.78378%2017.822%203.78378%2017.3823V17.366C3.78378%2016.9263%203.45405%2016.5626%203.01622%2016.5626V16.5571ZM18.3784%200H1.62162C0.724324%200%200%200.727429%200%201.62857V12.4857C0%2013.3869%200.724324%2014.1143%201.62162%2014.1143H18.3784C19.2757%2014.1143%2020%2013.3869%2020%2012.4857V1.62857C20%200.727429%2019.2757%200%2018.3784%200ZM10%203.25714C11.0811%203.25714%2011.9568%204.13657%2011.9568%205.22229C11.9568%206.308%2011.0811%207.18743%2010%207.18743C8.91892%207.18743%208.04324%206.308%208.04324%205.22229C8.04324%204.13657%208.91892%203.25714%2010%203.25714ZM13.2865%2010.9114C13.2865%2011.1774%2013.0865%2011.4%2012.8378%2011.4H7.16757C6.91892%2011.4%206.71892%2011.1829%206.71892%2010.9114V10.45C6.71892%209.56514%207.37838%208.84857%208.2%208.84857H11.8108C12.627%208.84857%2013.2919%209.56514%2013.2919%2010.45V10.9114H13.2865ZM18.9189%2016.5571H11.0378C10.6%2016.5571%2010.2703%2016.9209%2010.2703%2017.3606V17.3769C10.2703%2017.8166%2010.6%2018.1803%2011.0378%2018.1803H18.9189C19.3676%2018.1803%2019.7297%2017.8166%2019.7297%2017.366C19.7297%2016.9154%2019.3676%2016.5517%2018.9189%2016.5517V16.5571Z'%20fill='%237A7A7A'/%3e%3cpath%20d='M7.0269%2019C7.92249%2019%208.64852%2018.2709%208.64852%2017.3714C8.64852%2016.472%207.92249%2015.7429%207.0269%2015.7429C6.1313%2015.7429%205.40527%2016.472%205.40527%2017.3714C5.40527%2018.2709%206.1313%2019%207.0269%2019Z'%20fill='%237A7A7A'/%3e%3c/g%3e%3cdefs%3e%3cclipPath%20id='clip0_1666_2977'%3e%3crect%20width='20'%20height='19'%20fill='white'/%3e%3c/clipPath%3e%3c/defs%3e%3c/svg%3e) Kibot Class
Kibot Class  Daily Info
  [email protected]
'%3e%3cpath%20d='M15.6504%205.57384C15.5748%205.57384%2015.5046%205.58472%2015.429%205.59559C14.6678%202.38724%2011.8498%200%208.4919%200C5.13401%200%202.31597%202.38724%201.54938%205.59559C1.4846%205.58472%201.41442%205.57384%201.34963%205.57384C0.604636%205.57384%200%206.18289%200%206.93331V8.56468C0%209.31511%200.604636%209.92416%201.34963%209.92416C1.51159%209.92416%201.66815%209.89153%201.81391%209.83715C2.2134%2010.8432%203.17974%2011.5555%204.31883%2011.5555C4.61575%2011.5555%204.85869%2011.3108%204.85869%2011.0117C4.85869%2010.7127%204.61575%2010.4679%204.31883%2010.4679C3.42807%2010.4679%202.69927%209.73383%202.69927%208.83658V7.11277C2.81804%203.92072%205.36615%201.35947%208.4919%201.35947C11.6177%201.35947%2014.2953%204.04036%2014.2953%207.33572C14.2953%207.34659%2014.3007%207.36291%2014.3007%207.37378V8.56468C14.3007%209.31511%2014.9054%209.92416%2015.6504%209.92416C16.3954%209.92416%2017%209.31511%2017%208.56468V6.93331C17%206.18289%2016.3954%205.57384%2015.6504%205.57384Z'%20fill='%2300FFEF'/%3e%3cpath%20d='M12.9238%2013.1814H11.342C10.9911%2013.1814%2010.6564%2013.3555%2010.4567%2013.6437L9.34997%2015.2424C8.91809%2015.8678%207.99494%2015.8623%207.57385%2015.2315L6.51574%2013.66C6.31599%2013.3609%205.98128%2013.1814%205.62498%2013.1814H4.0702C2.06734%2013.1814%200.442383%2014.8182%200.442383%2016.8357V18.4562C0.442383%2018.7553%200.685317%2019%200.982237%2019H16.0226C16.3195%2019%2016.5624%2018.7553%2016.5624%2018.4562V16.8357C16.5624%2014.8182%2014.9375%2013.1814%2012.9346%2013.1814H12.9238ZM8.4916%2011.822C10.9479%2011.822%2012.94%209.81539%2012.94%207.34115C12.94%204.8669%2010.9479%202.86032%208.4916%202.86032C6.03527%202.86032%204.04321%204.8669%204.04321%207.34115C4.04321%209.81539%206.03527%2011.822%208.4916%2011.822Z'%20fill='%2300FFEF'/%3e%3c/g%3e%3cdefs%3e%3cclipPath%20id='clip0_1666_3068'%3e%3crect%20width='17'%20height='19'%20fill='white'/%3e%3c/clipPath%3e%3c/defs%3e%3c/svg%3e) 1:1 Inquiry
1:1 Inquiry
'%3e%3cpath%20d='M22.2288%2017.6132L21.3269%2016.3396L15.4217%208H9L17.7344%2020.4479L18.6348%2021.7311L24.4368%2030H31L22.2288%2017.6132ZM19.595%2020.6309L18.6954%2019.3487L11.7099%209.39322H14.6709L20.3671%2017.4373L21.2697%2018.7122L28.2762%2028.6068H25.1917L19.5951%2020.6308L19.595%2020.6309Z'%20fill='%23010416'/%3e%3cpath%20d='M18.6955%2019.3486L19.595%2020.6309L18.6348%2021.731L11.4177%2029.9999H9.38086L17.7344%2020.4478L18.6955%2019.3486Z'%20fill='%23010416'/%3e%3cpath%20d='M30.6192%208L22.2288%2017.6132L21.2695%2018.7122L20.3671%2017.4373L21.3269%2016.3396L28.62%208H30.6192Z'%20fill='%23010416'/%3e%3c/g%3e%3cdefs%3e%3cclipPath%20id='clip0_574_9336'%3e%3crect%20width='22'%20height='22'%20fill='white'%20transform='translate(9%208)'/%3e%3c/clipPath%3e%3c/defs%3e%3c/svg%3e)


Terms and Privacy Policy
(c)2023-2024Kibot Chart
Score Chart Explanation
The Kibot Score Chart is a chart created to compare the real-time coin price on the Binance Exchange and the Kibot Score.
It presents service users with the probability of cryptocurrency rising, falling, and sideways movement.
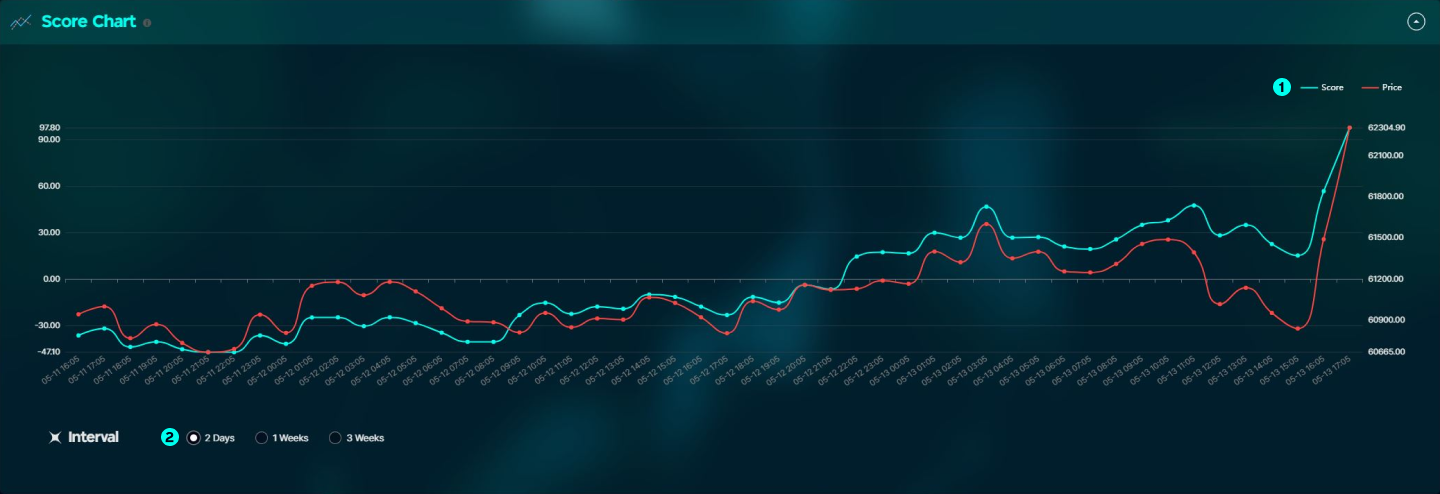
The Score(blue line) and Price (red line) appear simultaneously, and the Score line predicts the fluctuating price of each coin.
If the Score is above the Price and the gap is wide, there is a high probability of it rising,
and if it is below the Price, there is a probability of it falling. If they are similar,
we judge that there is a chance of a sideways move.
These buttons allow you to predict the direction of the coin price by selecting the desired period.
You can predict the rise and fall in the price of a specific cryptocurrency and use it for investment.
The 2-day and 1-week charts are suitable for day trading, and are likely to move in the direction of the Kibot Score chart within 6 hours at the shortest or 48 hours at the longest.
The 3-week chart can predict the direction of coin prices from a long-term perspective of 2 weeks to 1 month.
The best signal on the score chart is that all period charts are in the same direction,
and if the Kibot RSI shown on the meta chart is towards L, there is a very high probability that the price will move in that direction.